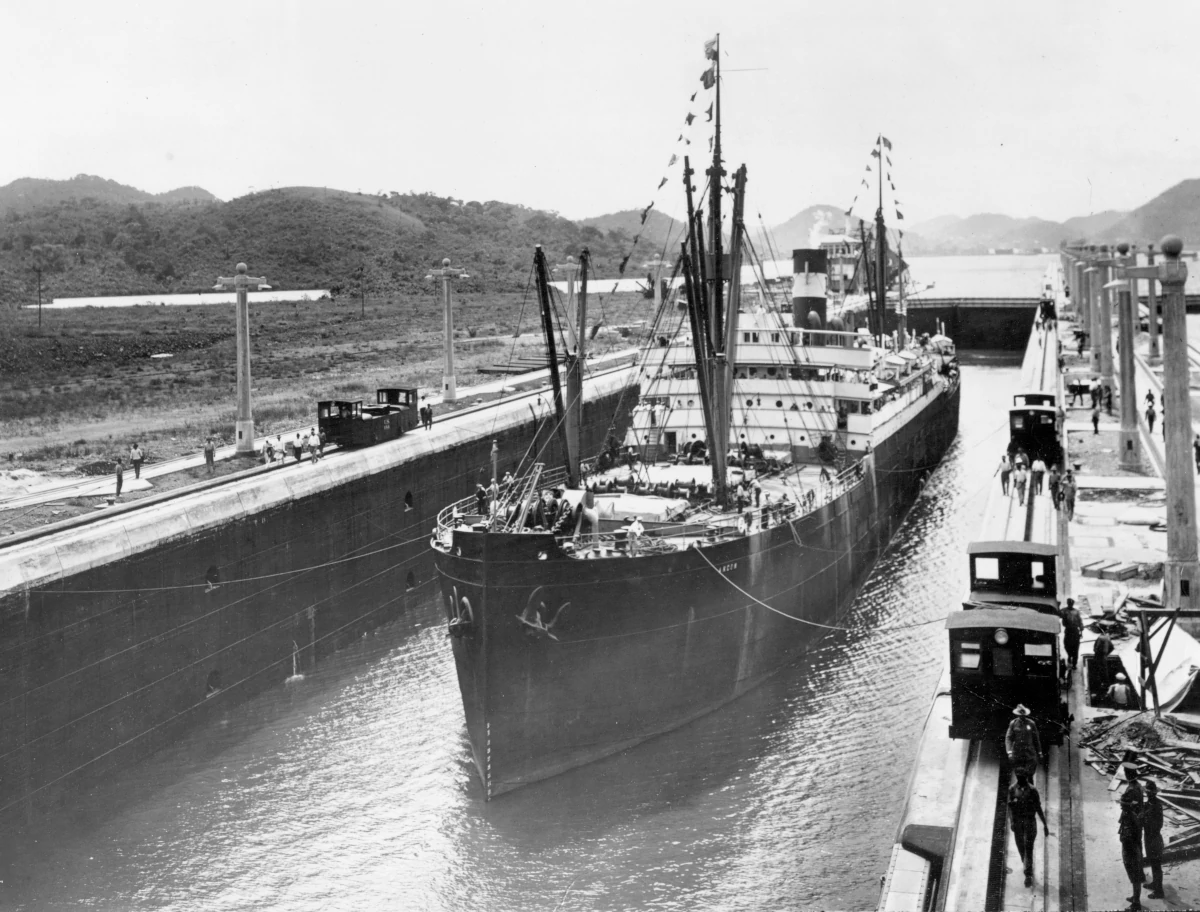
The following chart shows the maximum force employed during each year of construction work
| Date | Work Force |
|---|---|
| May, 1904 | 1,000 (Approx.) |
| Nov., 1904 | 3,500 |
| Nov., 1905 | 17,000 |
| Dec., 1906 | 23,901 |
| Oct., 1907 | 31,967 |
| Apr., 1908 | 33,170 |
| Oct., 1909 | 35,495 |
| Mar., 1910 | 38,676 |
| Dec., 1911 | 37,826 |
| June, 1912 | 38,174 |
| Aug., 1913 | 39,962 |
| June, 1914 | 33,270 |
The following table shows the total number of contract laborers brought to the Isthmus throughout the work. It does not include the number of workers recruited from the United States.
| Spain | ||||||||||
| Cuba | ||||||||||
| Italy | ||||||||||
| Greece | ||||||||||
| France | ||||||||||
| Armenia | ||||||||||
| Total Europeans |
||||||||||
| Fortune Island | 361 | |||||||||
| Barbados | 404 | 3,019 | 6,510 | 3,242 | 2,592 | 3,605 | 528 | |||
| Guadeloupe | 2,039 | 14 | ||||||||
| Martinique | 2,733 | 585 | 2,224 | |||||||
| Jamaica | 47 | |||||||||
| Trinidad | 1,079 | 205 | 143 | |||||||
| Curacao | 23 | |||||||||
| St. Kitts | 933 | 9 | ||||||||
| St. Lucia | 55 | |||||||||
| St. Vincent | 296 | |||||||||
| Grenada | 93 | |||||||||
| British Guiana | 332 | |||||||||
| Total West Indies |
404 | 5,799 | 9,491 | 7,505 | 2,592 | 3,605 | 205 | 942 | 528 | |
| Costa Rica | 244 | |||||||||
| Colombia | 1,077 | 416 | ||||||||
| Panama | 334 | 10 | 13 | |||||||
| Not classified | 69 | |||||||||
| Grand Total | 404 | 7,454 | 12,602 | 14,944 | 4,423 | 3,605 | 205 | 942 | 528 |